Blog
The IT & SAM Leader’s Guide to Smarter Zoom License Management
Table of Contents ToggleSaaS Grew Faster in 2020, Despite – or...
Back
Back
Search for Keywords...
Blog
12/11/2020
Table of Contents
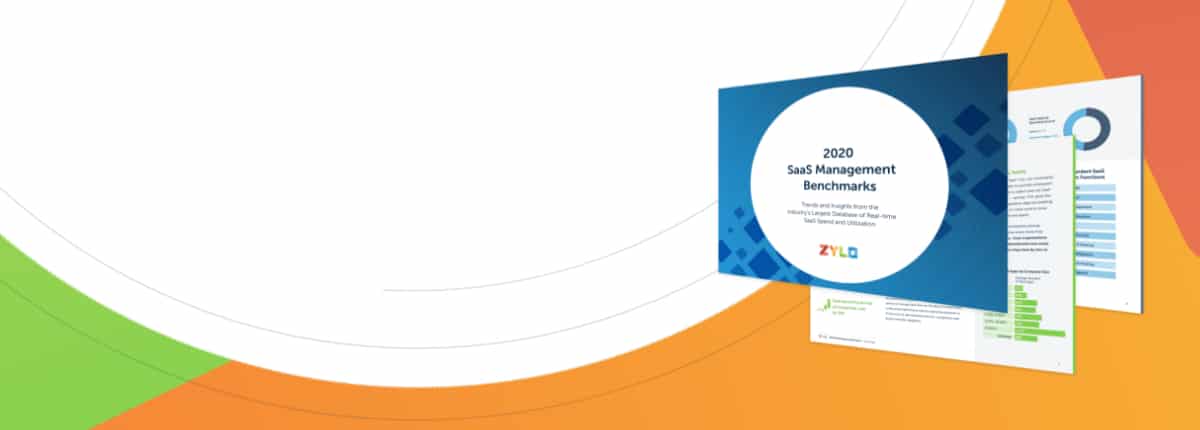
Now in its third year, the SaaS Management Benchmarks report for 2020 utilizes data sourced from the Zylo Discovery Engine, which has processed nearly $300 billion in supplier spend to identify more than $20 billion in cloud spending accurately.
Of that $20 billion in cloud spending, in the last 12 months, more than $5 billion in SaaS spending has been identified and analyzed, empowering hundreds of Zylo customers to manage and optimize their organization’s SaaS stack.
Below, you’ll find a highlight summary of the 2020 SaaS Management Benchmarks. For comparison, be sure to check out the 2022 report, now called the SaaS Management Index.
Overall, SaaS growth was projected to be reduced due to the effects of the global pandemic. Gartner projected the total SaaS market to earn more than $104 billion in revenue in 2020 – a modest 2.5% gain against 2019’s revenue total.
However, year over year, SaaS spend actually increased by 14% among Zylo customers. The most notable factor about this annual change was a big uptick in spending during the initial months of the pandemic: From February through April 2020, Zylo customers spent 26% more on SaaS applications during the same period in the previous year.
From February through April 2020, Zylo customers spent 26% more on SaaS applications during the same period in the previous year.
This spending created more SaaS applications to manage within the typical organization’s technology environment. On average, a typical company now holds 651 SaaS applications within its digital footprint, a 9% increase over last year’s average.
While this number is astounding on its own, what’s alarming is that without a way to discover and identify SaaS applications accurately, most companies underestimate the number of SaaS applications within use in their environments by two to three times. The average company may estimate they have 200 to 300 apps in use – but in reality, the number is north of 600.
Much of this spending resulted from companies rapidly transforming their workforces for distributed and remote work, which is made possible and secure by SaaS tools such as video conferencing, identity management solutions, and virtual private networks.
SaaS applications in these functional categories showed notable YOY growth amongst Zylo customers:
More companies, especially in light of the forced transition to work-from-home sparked by the pandemic, are investing in SaaS applications that help reduce and avoid risk.
2022 SaaS Management Index
Learn MoreIt’s no secret that SaaS applications market themselves towards business unit leaders and employees. With increasing specialization towards verticals such as Marketing, HR, and Finance, the IT team is no longer the primary purchaser of mission-critical applications.
As savvy digital consumers themselves, employees also contribute significantly to the number of SaaS apps within use at the typical business, as low-cost and freemium digital tools are widely available.
If you want to manage the costs and risks of SaaS use within your organization, look closely at expense spending. One in four employees uses expense reimbursement to acquire SaaS applications.
Overall, only 7% of total SaaS spending is sourced from expensed transactions such as credit card reimbursement or the use of company-issued credit cards. However, this purchase source creates 52% of all SaaS applications within the business.
For more in-depth analysis of the topics above and others, including insights into the most redundant SaaS applications and new changes in how frequently companies renew SaaS applications, download the full Benchmarks report.
Table of Contents ToggleSaaS Grew Faster in 2020, Despite – or...

Table of Contents ToggleHow FinOps Teams Commonly Understand SaaS—and What’s MissingSaaS...

Table of Contents ToggleWhat Is an E-Commerce Tech Stack?Why Your E-commerce...
Table of Contents ToggleSaaS Grew Faster in 2020, Despite – or...
| Cookie | Duration | Description |
|---|---|---|
| cookielawinfo-checkbox-analytics | 11 months | This cookie is set by GDPR Cookie Consent plugin. The cookie is used to store the user consent for the cookies in the category "Analytics". |
| cookielawinfo-checkbox-functional | 11 months | The cookie is set by GDPR cookie consent to record the user consent for the cookies in the category "Functional". |
| cookielawinfo-checkbox-necessary | 11 months | This cookie is set by GDPR Cookie Consent plugin. The cookies is used to store the user consent for the cookies in the category "Necessary". |
| cookielawinfo-checkbox-others | 11 months | This cookie is set by GDPR Cookie Consent plugin. The cookie is used to store the user consent for the cookies in the category "Other. |
| cookielawinfo-checkbox-performance | 11 months | This cookie is set by GDPR Cookie Consent plugin. The cookie is used to store the user consent for the cookies in the category "Performance". |
| viewed_cookie_policy | 11 months | The cookie is set by the GDPR Cookie Consent plugin and is used to store whether or not user has consented to the use of cookies. It does not store any personal data. |