03/17/2022
Table of Contents
For over five years our customers have been well aware that by the nature of our platform, Zylo holds valuable data. And they’d be interested in obtaining it to drive their SaaS Management decisions. Customers often call our Zylo SaaS Consultants and ask, “What’s the most popular virtual whiteboard tool right now?” “Do your other customers in our industry tend to have more than 30 project management tools?” “Do other companies expense SaaS as much as we do?”
With a glance at internal dashboards, quick conversations with teammates, and a quick query or two, we had a data-driven answer. No guessing, no rating and review site nonsense, and rather quickly too. Our customers win with data-driven benchmarks to drive action, and Zylo wins by growing our position as the most trusted SaaS Management experts in the industry.
That is great, except for one problem. It was just too manual. It couldn’t scale in a reality where every company in the world needs SaaS benchmarking insights. A reality that is fast approaching.
An automated solution was required for something that has historically been a manual exercise across the software industry in general (looking at you analysts). While the idea for Zylo Benchmarks was born years ago, creating and bringing something so powerful to the market took a special combination of people and technology.
Creating Zylo Benchmarks: Unpacking the Data
Before even considering a solution and design that would please customers, we had to unpack the data we were sitting on. You’ll see here why we are lucky to employ some of the brightest data minds in enterprise software.
I won’t drag you through the details, but a few key examples of data dimensions we had to consider:
- How much SaaS transaction data do we have? (Spoiler alert – almost $1T)
- How many SaaS applications do we know about?
- How much SaaS contract and license price data do we have?
- Do we have data about the typical makeup of a SaaS portfolio for different types of companies?
I hate using “a lot” in any writing, but… Zylo holds a lot of SaaS Management data. After more than five years in operation as a humble startup, we’ve processed $835B in SaaS transaction data and have $21B in spend under management today. That’s what happens when you tackle the enterprise market from the start.
Every transaction that has passed through our doors runs through a proprietary matching and SaaS discovery model – the Discovery Engine. This means every last cent has been thoroughly classified and categorized. And it’s structured in a way our customers can use and understand with ease.
These transactions have led us to actively manage nearly 20,000 unique SaaS applications in a proprietary internal library, known as the Zybrary. The Zybrary is the most vital secret ingredient in the recipe that makes our platform so tasty. Without it, most of the magic of SaaS Management just wouldn’t be possible.
So you’re starting to get the point. A nearly 20,000 application Zybrary, almost $1T in SaaS spend data, and over five years of anonymized and aggregated contract and license data. This data is growing exponentially, by the way. This data, and more beneath it, is the heartbeat that keeps Benchmarks alive.
Creating Zylo Benchmarks: Simplifying the Data
If you ask a typical customer what they want out of Zylo Benchmarks before they see it, they might say something like, “Can’t you just send me all the data you have?” If you read the last section, you might be snickering at that question. But I promise it’s one we hear all the time.
After thorough diligence in Product Management land, we learned that (of course) what customers really mean to ask is, “Can you provide me with easy-to-understand and actionable information about my SaaS portfolio, the most popular applications in the market, and license unit price data – in the context of companies similar to mine?”
Yes, we can do that.
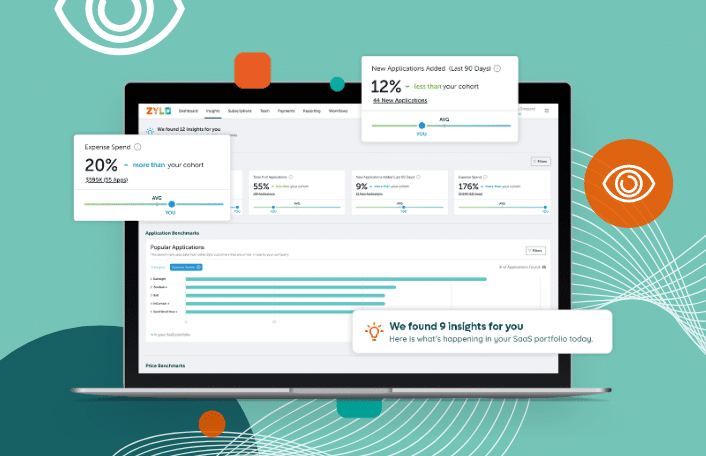
We ultimately simplified our initial release of Zylo Benchmarks to three key features:
- Portfolio Benchmarks
- Popular Application Benchmarks
- Price Benchmarks
All three provide you with a dedicated, real-time research and scenario style benchmarking tool. Plus, embedded benchmarks throughout the rest of the application.
Creating Zylo Benchmarks: Making It Actionable
Watching customers eagerly adopt Zylo Benchmarks has been thrilling. Within an hour of turning on the lights for any given customer, you can see the smiles on their faces. The gears turn as they realize all their hunches have been right – and wrong – on their roles managing SaaS.
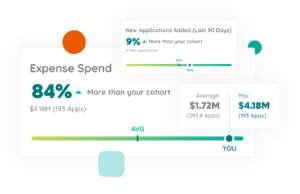
The CIO realizes their company expenses software far more than their peers, but their overall annual SaaS spend is lower than their cohort’s average. The app owner advocating for a particular project management tool finally has the proof that it is indeed best in class amongst similar companies. And the procurement owner for a major renewal is armed with the data needed to strike a balance between maintaining a healthy partnership with a preferred vendor and driving savings on an expensive new license the business needs.
In a landscape that shifts so quickly year to year and even month to month, Zylo Benchmarks will remain valuable, relevant, and evolving to SaaS Management for years to come. As one trend fades and another grows, Zylo Benchmarks has the data to prove what is a fad and what will stick. That will allow you to run a best-in-class SaaS Management program with the data to back it up.
The End (Just the Beginning)
Shout out to the brilliant engineers, data scientists, product designers, SaaS consultants, and marketers that made Zylo Benchmarks possible. You know who you are.
No promises, but I have a feeling we’ll expand our offerings in this space in the near future. Have something you’d like to see, or want to check out a Benchmarks demo? Reach out to us!
ABOUT THE AUTHOR

Chase Thompson
Chase is a Product Manager at Zylo, the world's leading SaaS Management and Optimization platform.


