Table of Contents
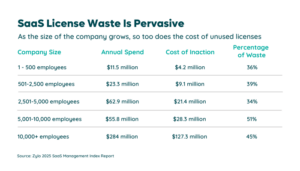
Having visibility into your application usage is important to kick-start your SaaS optimization journey. To understand why it’s important, let’s begin with this startling stat from our SaaS Management Index: on average, companies are wasting $21M on unused SaaS licenses every single year.

How? Two reasons.
- Employees join and employees leave. Your headcount will change, but the number of seats in your SaaS contracts won’t unless you’re proactive about it.
- Team preferences are hyper-specific (and they change). Plenty of companies introduce a brand new project management platform, only to have most of the team continue using Slack and Google Sheets.
In both cases, understanding your SaaS usage (how much employees are actually using the SaaS tools you have in place) will give you a starting point for optimization.
In this article, we discuss the challenges of not having visibility into your software usage, outline why it’s important to have that visibility, and examine key usage metrics and what they might indicate for optimization.
Why Application Usage Is Critical for Optimizing Your SaaS Spend
Knowing how much you spend on all of your SaaS products is helpful, but it doesn’t give you much to work with in terms of optimization. The only way you’ll know which applications are worthwhile for your business—and which are not—is to dig into how your teams are using the tools.
Are those with licenses logging in on a consistent basis? Are they using the most important features, or turning elsewhere for what they need? Do you have unused licenses that have flown under the radar?
“We had no clue what was installed, how many products were being used, how many users there were, and that was causing us all kinds of problems.”
— Ash Rai, Director, Office of the CIO at Adobe
In short, not having visibility into your application usage makes it nearly impossible to identify opportunities to scale back licenses, prepare for renewals, and reign in your SaaS spend.
For example, Keap leveraged usage analytics to drive optimization and security, gaining visibility into their SaaS portfolio in the process and ultimately increasing IT efficiency and productivity.
The organization already had SSO in place with Okta, and the integration with Zylo allowed systems engineers to identify usage insights across all of the organization’s applications.
“Okta and Zylo really compliment each other,” said Josh McCoy, one of Keap’s systems engineers. “[The partnership] allows us to make informed decisions and better communicate with the business around where we are going strategically, what opportunities we have, and then, how we can best partner with the business to provide solutions and services that are in line with our strategic goals to help small businesses.”
How the Zylo Discovery Engine Powers the Most Comprehensive SaaS Management Platform
Learn MoreWhich Metrics Give You SaaS Usage Insights?
The three most important metrics for application usage:
Application Usage by Category
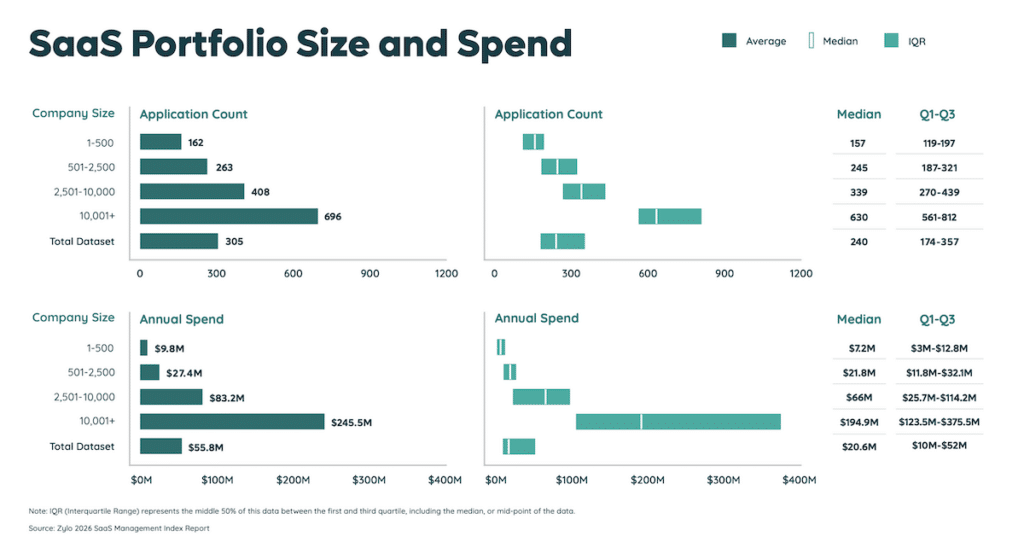
The average company has 275 SaaS applications in their tech stack and spends $4,830 per employee on SaaS tools. Clearly, there’s some room for optimization.
While you can rightsize contracts based on the number of licenses you need, and review utilization to cut underused applications, the most impactful place to start will be with the big picture.
Start by categorizing the SaaS apps you have in place, then look for overlap in the functionality of each application within each category. The most common categories with redundancy include training software, project management, and collaboration and video conferencing apps.
Low or No Utilization
Our data shows that nearly 53% of all SaaS licenses are underutilized—meaning employees with assigned (and paid for) seats aren’t regularly logging in and using the application.
According to our SaaS Benchmarks guide, “under-utilization not only diminishes value in the form of overpayment for software that’s not being used”. It also means you don’t have as much room to adopt new tools that could be even more beneficial to your organization.
Read More: The 5 SaaS Benchmarks to Drive Collaboration
For example: maybe someone adopted a tool 11 months ago, but the team has since moved onto new projects and tools. Are you still paying for it? Will it renew at the 12 month mark?
Taking time to review whether or not your applications are being utilized will give you a short list of applications that may not be necessary for your organization. We recommend aiming to keep only applications with 90% or more utilization.
Number of Licenses
Your team grows and shifts. The number of Zoom seats and Tableau licenses you need this month will most likely be different than your needs three months from now.
Keeping tabs on the licenses you’re paying for—compared to the number of licenses you need—will help you ensure that your SaaS budget reflects your software usage.
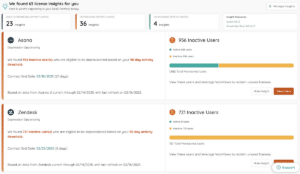
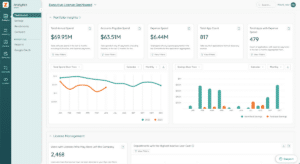
You can automate license optimization, too: Zylo’s dashboard analyzes application data to discover users who underuse licenses, sends an alert asking if they’re willing to give up their license, and then deprovisions inactive users or those who voluntarily return their license. (You can read more about how Zylo automates software license tracking here.)
While you can get even more granular with your application usage metrics, these three areas should give you what you need to work with business units to identify the right software for their use cases, optimizing SaaS costs in the process.
If you’re looking to start tracking these application usage metrics on your end, read more about how the Zylo Discovery Engine powers the most comprehensive SaaS Management Platform.

 — Ash Rai, Director, Office of the CIO at Adobe

