175+ Unmissable SaaS Statistics for 2026

Updated February 8, 2026 to include current SaaS statistics.
SaaS remains central to how organizations operate, but the way software is bought, priced, and managed is changing rapidly. AI is now embedded across applications, consumption-based pricing is becoming more common, and cost volatility has replaced predictable growth as a defining challenge.
As organizations move into 2026, the focus is no longer on how many tools they use, but on how well they control cost, risk, and value across increasingly complex portfolios. The SaaS statistics below highlight where spend is rising, where exposure is growing, and which trends will shape software strategy in the year ahead—drawing on Zylo’s proprietary benchmarks and leading industry research.
Key SaaS Statistics to Watch in 2026
1. Organizations spend an average of $55.7M annually on SaaS. (Zylo’s 2026 SaaS Management Index)
2. The average company manages 305 SaaS applications. (Zylo’s 2026 SaaS Management Index)
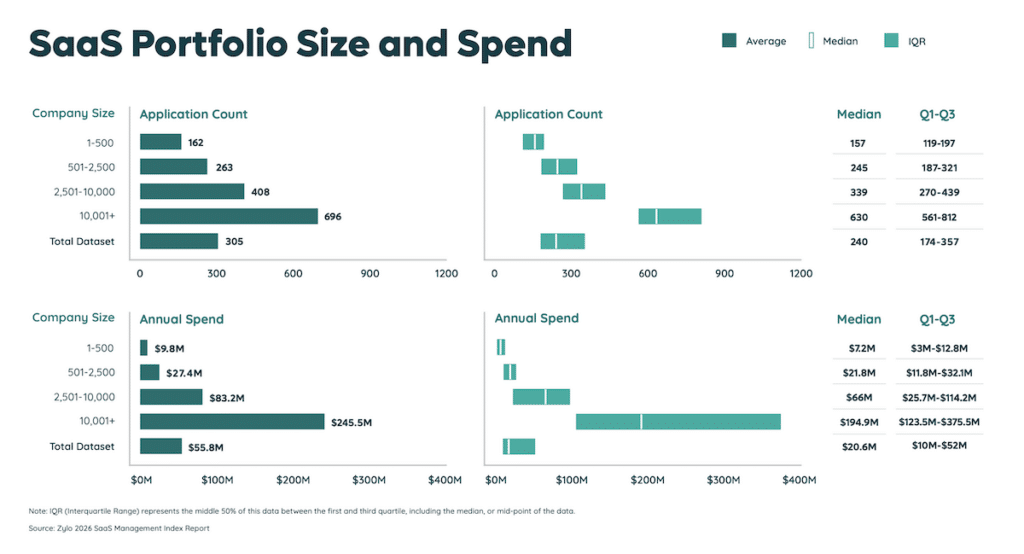
3. SaaS application counts declined slightly by 0.07% year over year, signaling stabilization rather than continued sprawl. (Zylo’s 2026 SaaS Management Index)
4. Despite flat portfolios, total SaaS spend increased 8% year over year. (Zylo’s 2026 SaaS Management Index)
5. 61% of organizations were forced to cut projects or initiatives due to unplanned SaaS cost increases. (Zylo’s 2026 SaaS Management Index)
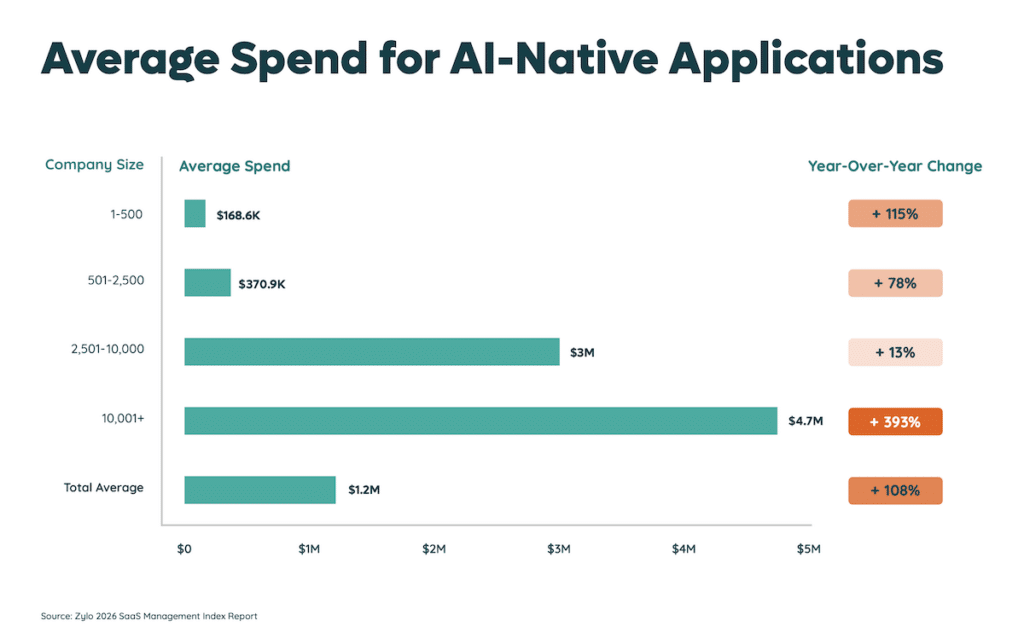
6. Spending on AI-native SaaS applications increased 108% year over year. (Zylo’s 2026 SaaS Management Index)
7. Gartner projects global software spending will reach $1.43T in 2026.
8. According to the State of FinOps 2025 Report, 63% of organizations now manage AI spend, with adoption projected to reach 96% by 2026.
Together, these numbers point to a fundamental shift in SaaS economics. Application growth is no longer the primary driver of rising costs. Pricing mechanics, AI monetization, and usage-based models now exert far greater pressure on budgets. As SaaS portfolios stabilize, financial volatility continues to increase. This will force organizations to rethink governance, renewal discipline, and cross-functional ownership. In 2026, visibility and control—not expansion—will define successful SaaS strategies.
SaaS Growth Statistics
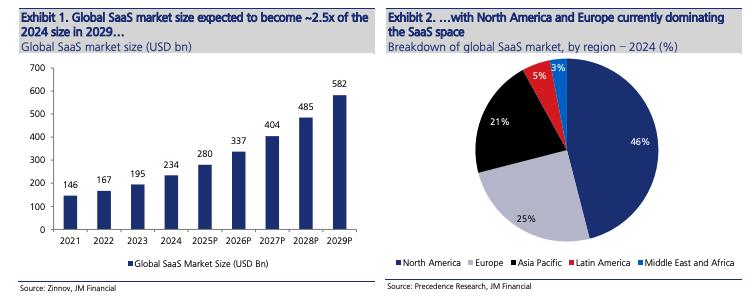
9. The global SaaS market was valued at $408.21B in 2025.10. The global SaaS market is forecast to reach $465.03B in 2026.11. The SaaS market is projected to expand at a compound annual growth rate (CAGR) of 13.32% from 2025 to 2034.12. Worldwide IT spending is forecast to exceed $6T in 2026.

13. Gartner forecasts software spending to grow 15.2% year over year in 2026.14. Software is projected to be the fastest-growing IT spending category in 2026.
The SaaS industry’s foundation remains strong in 2026:
- Revenue continues to climb.
- Regional markets are scaling rapidly.
- Strategic investment interest remains high despite broader economic fluctuations.
Market forecasts show strong growth through the end of the decade. This reflects sustained enterprise reliance on cloud-delivered software, with accelerating demand across industries and regions. Together, these figures paint a picture of an industry that is maturing in scale while still expanding in reach.
SaaS Revenue and Pricing Statistics
15. 79% of IT leaders encountered price increases at SaaS renewal in the past 12 months. (Zylo’s 2026 SaaS Management Index)
16. According to High Alpha’s Benchmark Report, 40% of companies with ARR above $50M include consumption- and outcome-based revenue in ARR (vs. 20–27% in smaller ARR bands).
17. Among all SaS companies, 41% report they are formally monetizing AI.
18. Of the monetizing companies, 53% use subscription pricing.
19. A further 11% do so via usage-based pricing.
20. Another 31% use hybrid pricing for AI monetization.
21. And finally, 5% use outcome-based pricing to monetize their AI offerings.

22. The average organization manages 211 SaaS renewals annually. (Zylo’s 2026 SaaS Management Index)
23. Organizations achieved an average of 17% savings during SaaS renewals using Zylo. (Zylo’s 2026 SaaS Management Index)
Consumption- and Usage-based Pricing Model Examples
24. HubSpot allocates a set number of credits per subscription tier; additional credits cost $10 per 1,000.
25. Zendesk charges up to $1 per resolution for top-offs for automated customer resolution. A certain number of automated resolutions are included in the plans so users can see it in action and buy the required top-offs ahead of time to avoid overage charges.
26. Monday.com prices AI credits top-offs at $0.01 per credit on annual plans. A preset number of monthly credits is included in each plan.
27. Chargeflow bills 25% of the recovered amount per successful chargeback as a usage-aligned fee when using the automation plan.
28. Intercom charges $0.99 per resolved customer conversation under its usage-aligned pricing.
Pricing Increase Examples from Major Vendors:
29. On August 1, 2025, Salesforce raised list prices by an average of 6% on Enterprise and Unlimited Editions of Sales Cloud, Service Cloud, Field Service, and select industry clouds. Source: Salesforce official pricing update.
30. Slack’s Business+ plan increased again since their June 2025 announcement, now costing $18 per user per month.
31. In December 2025, Microsoft announced commercial price increases for Microsoft 365 suite subscriptions, effective July 1, 2026, including plan-level changes: Business Basic rising from $6 to $7 per user per month, and Business Standard rising from $12.50 to $14.50 per user per month.
Pricing models in SaaS are no longer dominated by flat subscriptions alone. Consumption-based and hybrid pricing structures are growing rapidly as vendors seek to align cost with usage and value delivered. While flexible pricing can improve adoption and retention, it also introduces unpredictability for buyers—especially when variable charges accumulate outside traditional renewals.
Hybrid models aim to balance predictability and scalability, but they require sophisticated visibility and governance to manage effectively. Meanwhile, high-profile price increases from major cloud providers underscore that SaaS costs are not static: even core subscriptions can rise meaningfully year over year, highlighting the importance of proactive spend management.
SaaS Adoption and Usage Statistics
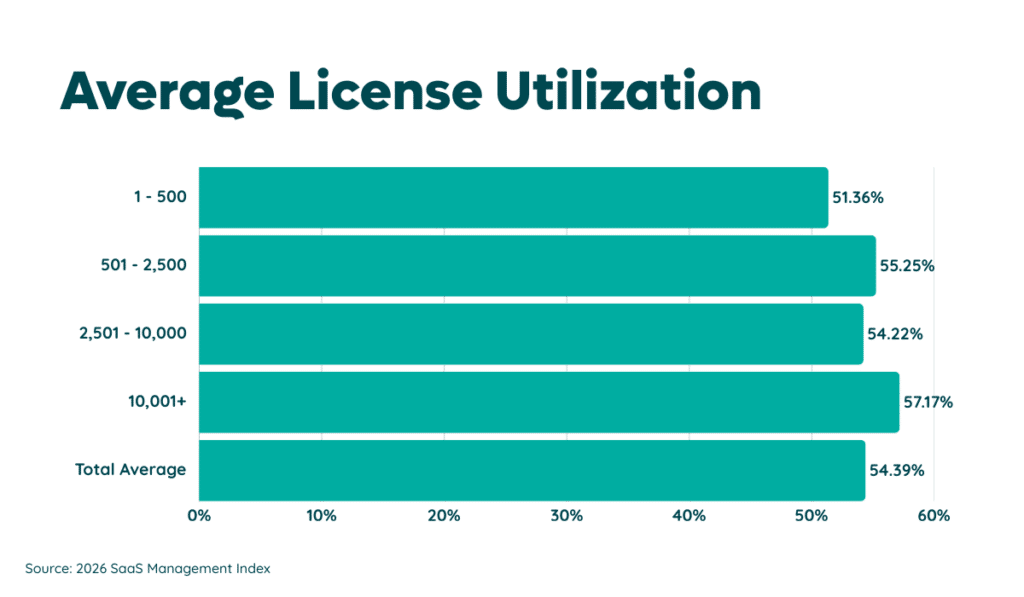
32. In 2025, license utilization went from 47% in 2024 to 54%—a 13% improvement. (Zylo’s 2026 SaaS Management Index)
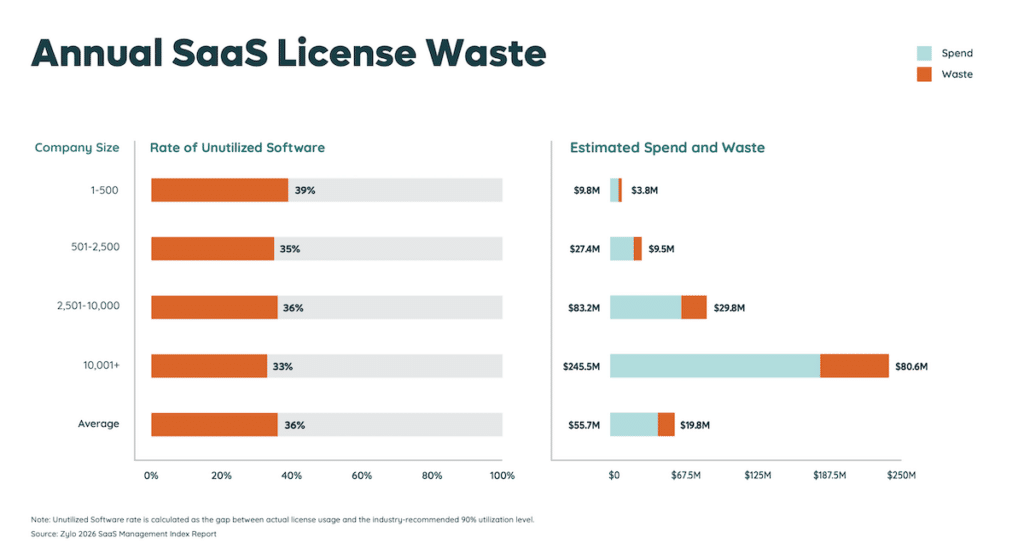
33. This improvement drove a 5.3% reduction in license waste from $20.9M to $19.8M, but there is still a significant opportunity for cost savings. (Zylo’s 2026 SaaS Management Index)
The near-universal adoption of SaaS across organizations demonstrates how entrenched cloud-delivered software has become, effectively replacing traditional on-premises applications in almost every enterprise.
However, the proliferation of SaaS tools brings both complexity and opportunity. While most organizations have deployed dozens of solutions, usage patterns vary widely across departments and teams, and inefficiencies such as underutilized licenses are common.
Now that automation and cloud-native deployments are so prevalent, SaaS is increasingly integral to daily business operations. This makes governance and usage optimization essential priorities for savvy businesses in 2026.
SaaS Churn Rate Statistics
34. The median gross revenue retention rate across B2B SaaS companies is approximately 90%, implying an annual gross revenue churn rate near 10%.
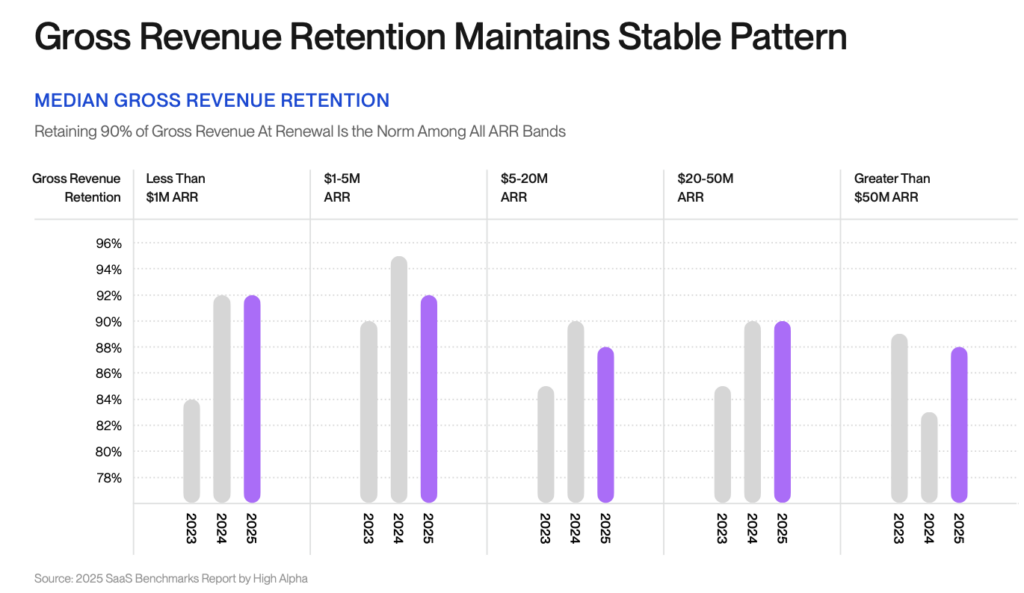
35. Gross revenue retention remains consistent across all ARR bands, from companies under $1 million in ARR to those exceeding $50M.
36. Companies with gross revenue retention above 93% fall into the highest-performing churn cohort.
37. Companies with gross revenue retention below 85% are in the lowest-performing churn cohort, signaling elevated customer churn.
38. Median net revenue retention remains at or above 100% across every ARR segment, indicating that expansion revenue offsets churn for the average SaaS company.
39. Upper-quartile SaaS companies achieve net revenue retention between 108% and 116%, depending on ARR size.
40. Lower-quartile SaaS companies report net revenue retention as low as 78%, reflecting severe churn pressure and limited expansion.
41. Among companies with high gross revenue retention, 49% also maintain high net revenue retention, indicating strong alignment between customer retention and expansion success.
42. 47% of companies with high net revenue retention also report high gross revenue retention, reinforcing retention as a primary growth driver.
Churn remains one of the most important metrics for SaaS health in 2026, directly influencing revenue stability and growth planning. While established B2B SaaS businesses tend to see modest churn rates in the low single digits annually, segments with smaller customers or less entrenched products face substantially higher churn.
Revenue churn rates often exceed customer churn. That’s because losing high-value accounts has an outsized impact on recurring revenue. For SaaS leaders, understanding churn in the context of customer segment, contract type, and usage patterns is critical: lower churn supports predictability and valuation while elevated churn signals a need for stronger onboarding, engagement, and retention strategies.
SaaS Spending Statistics: How Cost Volatility Is Reshaping Budgets in 2026
43. Median annual SaaS spend across organizations is $20.6M. (Zylo’s 2026 SaaS Management Index)
44. SaaS renewals account for 87% of total software spend across organizations. (Zylo’s 2026 SaaS Management Index).
45. Large enterprises with more than 10,000 employees spend between $123.5M and $375.5M annually on SaaS. (Zylo’s 2026 SaaS Management Index)
46. 77% of IT leaders experienced unexpected costs that surfaced after a SaaS contract was signed. (Zylo’s 2026 SaaS Management Index)
47. 78% of IT leaders reported unexpected charges tied to consumption-based or AI features in the past year. (Zylo’s 2026 SaaS Management Index)

SaaS spending in 2026 is no longer driven primarily by application growth. Instead, volatility stems from pricing complexity, AI monetization, and usage-based charges that surface outside traditional budgeting cycles. Even organizations with stable portfolios are experiencing rising costs and surprise expenses throughout the contract lifecycle—not just at renewal.
The data also highlights a disconnect between where savings exist and where attention is focused. With renewals representing the most significant opportunity to reclaim spend, organizations that lack structured renewal discipline risk compounding cost increases year over year.
SaaS Market Statistics: The Current State of the Industry
48. SaaS companies accounted for more than 2,600 global M&A transactions in 2025, reflecting renewed consolidation across the market.
49. SaaS M&A activity increased year over year as buyers prioritized scale, vertical specialization, and AI capability.
50. Vertical SaaS companies continue to outperform horizontal SaaS vendors in revenue efficiency and retention metrics.
51. Some AI-native software companies reach approximately $3M in annual recurring revenue within their first year and scale to roughly $100M by year four, exceeding typical early-stage SaaS growth timelines.
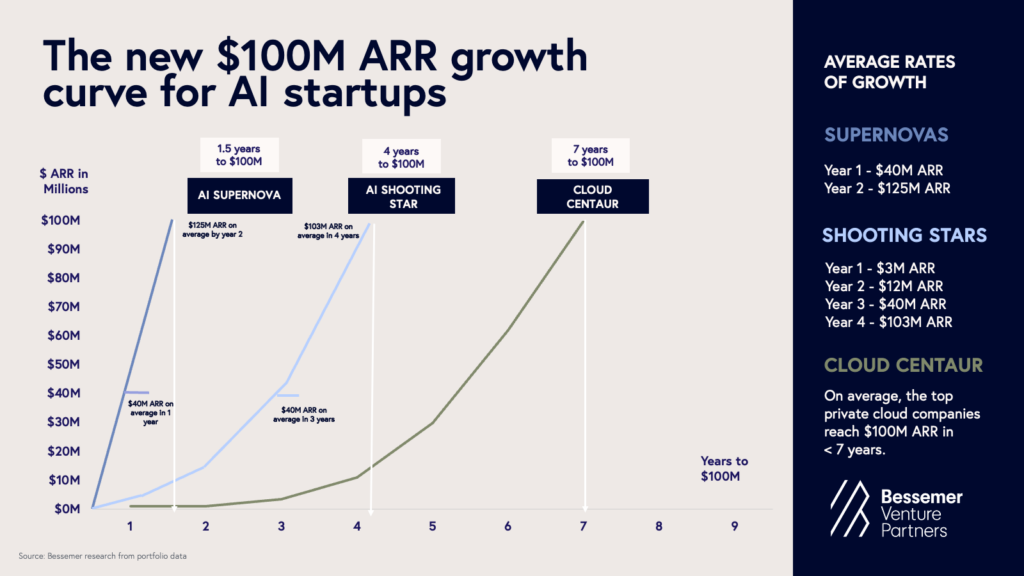
52. A subset of high-performing AI-native software companies achieves approximately $40M in ARR within the first year and exceeds $120M by the second year, far outpacing traditional SaaS growth benchmarks.
53. Traditional B2B SaaS companies historically required five to seven years to approach comparable revenue levels under conventional growth benchmarks such as T2D3.
54. SaaS vendors increasingly bundle AI functionality into core plans rather than offering it solely as optional add-ons. (Zylo’s 2026 SaaS Management Index)
55. By 2027, Gartner predicts that 70% of top SaaS vendors will offer consumption-based pricing for at least part of their portfolio.
The SaaS industry in 2026 reflects a market entering its next phase of maturity. Growth remains strong, but it is increasingly uneven—driven by AI-native platforms, vertical specialization, and pricing innovation rather than pure application expansion.
At the same time, consolidation activity and stabilization in public valuations suggest a recalibration of expectations around sustainable growth. For organizations buying SaaS, this environment means greater vendor complexity, more dynamic pricing strategies, and a heightened importance of understanding market forces that directly influence long-term software costs and risks.
SaaS Companies Shaping Enterprise Software In 2026
56. Microsoft reported more than $135B in annualized commercial cloud revenue, with Azure continuing to deliver double-digit growth across enterprise workloads.
57. Microsoft Azure revenue grew 29% year over year, driven largely by AI services and enterprise migration activity.
58. Salesforce reported $34.9B in annual revenue for fiscal year 2025, maintaining its position as the largest standalone enterprise SaaS provider by revenue.
59. Salesforce subscription and support revenue represented more than 93% of total company revenue, underscoring its pure SaaS business model.
60. Oracle reported $53B in total revenue for fiscal year 2025, with cloud services and license support accounting for over 77% of total revenue.
61. Oracle’s cloud infrastructure and cloud application revenue grew 25% year over year, reflecting continued enterprise cloud migration.
62. SAP reported €26.7B in cloud revenue for the first nine months of 2025, representing 23% year-over-year growth.
63. SAP’s current cloud backlog reached €15.7B as of Q3 2025, representing committed future cloud revenue from enterprise customers.
64. IBM generated more than $24B in hybrid cloud revenue, with Red Hat remaining a core driver of enterprise cloud modernization.
65. IBM’s software segment delivered 6% year-over-year growth, supported by hybrid cloud and AI-driven platform adoption.
Enterprise software in 2026 is increasingly shaped by a smaller number of vendors operating at significant scale, alongside application-focused SaaS providers with deep domain expertise. Rather than competing solely on individual tools, leading companies are expanding through integrated platforms, long-term contracts, and embedded AI capabilities.
These company-level statistics highlight several clear patterns shaping enterprise SaaS strategy:
- Large platform vendors such as Microsoft continue to anchor enterprise cloud and application ecosystems through expansive commercial cloud businesses and multi-year customer commitments.
- Salesforce remains the largest standalone SaaS provider by revenue, reinforcing the durability of application-led platforms built around core business functions like CRM.
- Oracle, SAP, and IBM demonstrate how traditional enterprise software providers are driving SaaS growth through cloud applications, hybrid platforms, and expanding cloud backlogs rather than pure infrastructure scale alone.
- Vendor consolidation increases long-term dependency, making renewals, pricing models, and contract structures more influential over total SaaS spend than initial purchasing decisions
Together, these dynamics illustrate why SaaS portfolios are becoming more complex over time. As organizations standardize around fewer but larger vendors, visibility into applications, spend, and contract terms becomes essential for maintaining flexibility, controlling costs, and aligning software investments with long-term business priorities.
SaaS Statistics By Region: Global Adoption and Spend Signals In 2026
United States
66. North America accounts for the largest share of global enterprise software spending.
Europe
67. Europe accounts for 25% of global SaaS revenue.
68. GDPR is one of the strictest privacy laws in the world, applying to over 30 European countries and to any business that touches the data of EU citizens.
69. GDPR and data residency rules increase SaaS operational complexity across multinational and European organizations.
India
70. India’s SaaS market generated more than $15B in revenue in FY24.
71. Indian SaaS revenue grew at a 24% compound annual growth rate (CAGR) from FY19 to FY24.
72. Approximately 250 India-based SaaS companies have reached $10M or more in annual recurring revenue (ARR).
73. Within this cohort, 36 companies have surpassed $100M in ARR.
74. The aggregate EBITDA margin across mature Indian SaaS companies is approximately 6.5%, indicating early profitability at scale.
75. SaaS gross margins among Indian providers typically range between 70% and 85%, reflecting subscription-led revenue models.
76. Horizontal SaaS accounts for 56% of total revenue among India-based SaaS companies, while vertical SaaS is growing faster from a smaller base.
77. Enterprise SaaS investment activity accelerated in 2025, with private equity investments reaching $1.38B in the first seven months of the year, up from $833M in all of 2024.
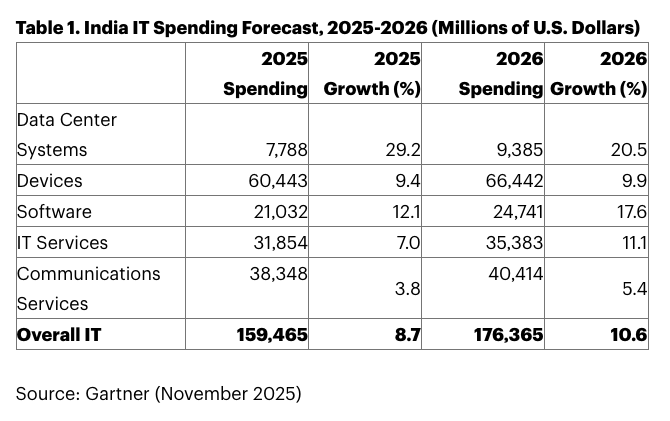
78. India’s IT spending is projected to exceed $176B in 2026, driven primarily by software and IT services growth.
79. India’s IT services spending alone is expected to grow 11.1% in 2026.
Asia-Pacific (APAC)
80. Asia-Pacific accounts for 20% of global SaaS revenue.
81. Australia’s total IT spending is forecast to reach A$172.3B in 2026, representing 8.9% year-over-year growth.
82. IDC forecasts Asia-Pacific security spending will reach $39.5B in 2026, with a projected 10% CAGR through 2029.
83. According to the Lenovo CIO Playbook survey, 96% of ASEAN organizations plan to increase AI investment, with enterprises expecting AI spend to rise 15% in 2026.
Middle East and North Africa (MENA)
84. Total IT spending across the Middle East and North Africa is projected to reach $169B in 2026, up 8.9% year over year.
85. Software spending in the MENA region is forecast to grow 13.9% in 2026, reaching $20.4B.
Latin America
86. Amazon Web Services announced a $4B investment in cloud infrastructure in Chile, with data centers expected to become operational in the second half of 2026.
87. Reuters reports Chile’s cloud computing market is projected to grow at an annual rate exceeding 20%, reflecting accelerating SaaS and cloud adoption in Latin America.
Regional SaaS growth patterns reflect both maturity and opportunity. North America continues to lead in spend and adoption, while other markets are scaling rapidly with specialized applications and local vendors. This global expansion creates additional complexity for governance, vendor management, and compliance. Teams managing international portfolios need tools and processes that adapt to regional nuances without losing central oversight.
AI And SaaS Statistics
88. Eight of the top 50 most expensed applications are AI-native, representing 16% of the top 50. (Zylo’s 2026 SaaS Management Index)
89. On average, organizations spend $1.2M on AI-native applications (apps where AI is core to the product). (Zylo’s 2026 SaaS Management Index)
90. Large enterprises saw AI-native application spend growth of 393%. (Zylo’s 2026 SaaS Management Index)
91. Artificial intelligence was the fastest-growing application category in 2025, expanding by 181% in the number of apps within portfolios. (Zylo’s 2026 SaaS Management Index)
92. 60% of IT leaders report they lack visibility into all generative AI tools in use. (Zylo’s 2026 SaaS Management Index)
93. 77% of IT leaders discovered AI-powered features or applications operating without IT’s awareness. (Zylo’s 2026 SaaS Management Index)
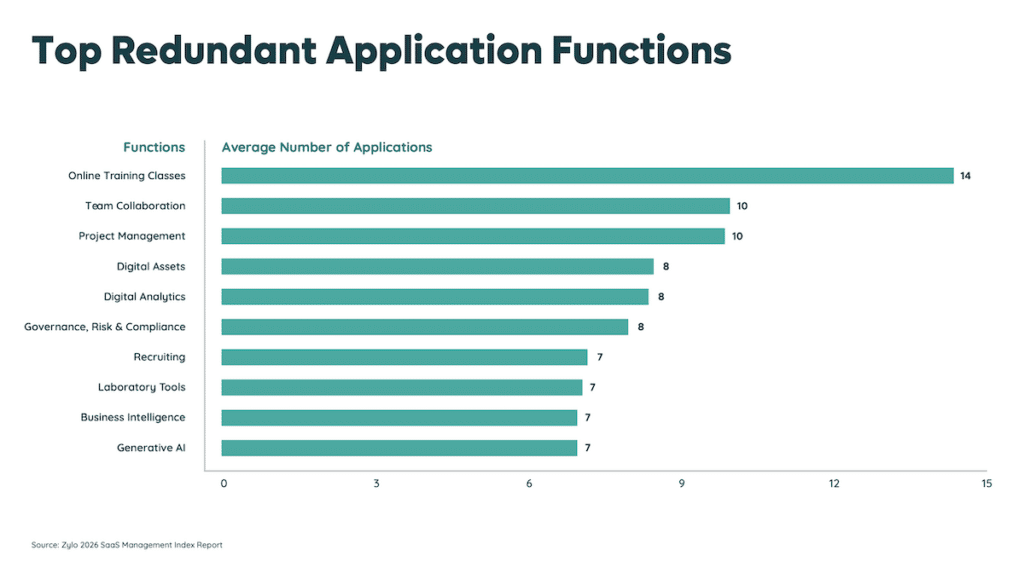
94. The Generative AI function appears on the “most redundant app functions” list for the first time, ranking #10, with an average of 7 apps in the portfolio. (Zylo’s 2026 SaaS Management Index)
95. In a survey of marketers, aggregated genAI adoption by category shows: content (79%), data (61%), and management (57%) as the top three categories (with relationships at 33% and sales at 28%).
96. In that same report, 60% of respondents said they use both new AI tools and embedded AI within existing tools, versus 23% who use exclusively new AI tools and 17% who use exclusively embedded AI.
AI is no longer just another SaaS category. It’s changing how software enters the business (more expense-led, faster, and harder to govern), how software is priced (more usage- and consumption-linked cost volatility), and how portfolios evolve (rapid AI category growth plus measurable redundancy). If you want AI adoption without runaway cost and security exposure, your operating model has to keep up with how AI is actually being purchased and embedded.
Increasing SaaS Challenges
Challenges for SaaS Companies
97. Median net revenue retention for B2B SaaS companies declined to 101%, down from 108% in prior benchmark periods, indicating reduced expansion revenue.
98. Median gross revenue retention fell to 90%, implying an average annual gross churn rate of approximately 10%.
99. The median sales efficiency (Magic Number) fell below 0.6 for early- and mid-stage SaaS companies, reflecting lower returns on go-to-market spend.
100. Median customer acquisition cost (CAC) payback increased to more than 24 months for SaaS companies with ARR under $50M.
101. SaaS companies with ARR under $25M reported negative median free cash flow margins, underscoring ongoing pressure to balance growth with profitability.
Workforce Challenges in SaaS
102. 39% of employees use apps not managed by their company on work devices.
103. 58% of IT practitioners report being overwhelmed by their daily job responsibilities and tasks.
104. The average IT worker reports having the capacity to support only 85% of the tickets received each day.
105. 49% of security and IT professionals say employee use of unapproved software has compromised their ability to maintain adequate protections.
Operational Challenges in SaaS Management
106. 38% of IT leaders say limited staffing or resources is the biggest challenge preventing them from realizing value from SaaS management. (Zylo’s 2026 SaaS Management Index)
107. 23% of IT leaders report difficulty trusting the accuracy of SaaS data as a major barrier to effective SaaS management. (Zylo’s 2026 SaaS Management Index)
108. 23% of IT leaders say outdated internal processes limit their ability to realize value from SaaS management initiatives. (Zylo’s 2026 SaaS Management Index)

SaaS organizations are navigating widespread headwinds—from tighter margins and slower revenue expansion to growing pressure on go-to-market efficiency. Inside the business, IT and security teams are stretched thin, lacking the resources to keep pace with rising ticket volumes, data accuracy issues, and software sprawl. Employees are adopting tools outside approved systems, increasing security risk and operational friction. Across both vendor and enterprise sides, the data points to a compounding set of financial, human, and process-driven challenges that demand more disciplined execution.
SaaS Security Statistics
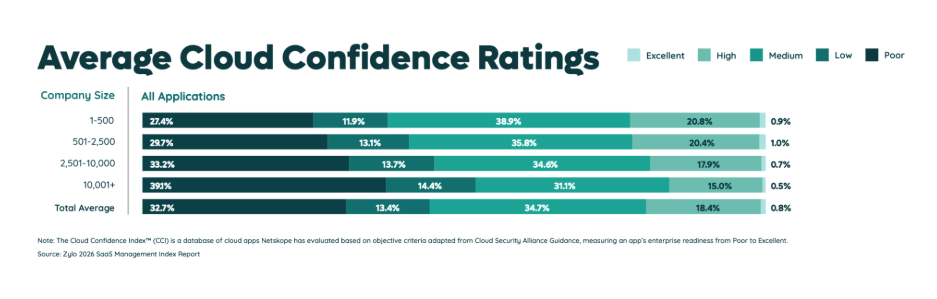
109. Only 24% of SaaS applications are rated “Excellent” based on Netskope’s Cloud Confidence Index. (Zylo’s 2026 SaaS Management Index)
110. 40% of SaaS applications are rated “Medium” risk. (Zylo 2026 SaaS Management Index)
111. 24% of applications are rated “Low” confidence. (Zylo 2026 SaaS Management Index)
112. 1.3% of SaaS applications fall into the “Poor” confidence category. (Zylo 2026 SaaS Management Index)
113. The global average cost of a data breach reached $4.45M in 2025.
114. Breaches involving cloud or SaaS environments cost $5.17M on average, higher than the global mean.
115. The average time to identify and contain a data breach in 2025 was 277 days.
116. Compromised credentials were the most common initial attack vector, accounting for 16% of incidents.
117. Organizations using AI-powered security and automation reduced breach costs by an average of $2.22M compared to those without.
Examples of SaaS Data Breaches
118. Okta confirmed unauthorized access to support-case files associated with 134 customers (less than 1% of Okta customers), including HAR files that contained session tokens.
119. In the MOVEit Transfer mass exploitation campaign, Emsisoft’s running tally reported 2,559 organizations and 66,369,148 individuals impacted (as of October 26, 2023).
120. Live Nation disclosed unauthorized activity in a third-party cloud database environment containing Ticketmaster data; the actor allegedly offered the data for sale shortly after discovery.
121. In the 2024 Snowflake-linked breach wave, hackers claimed access to 165 Snowflake customer accounts (attributed to stolen credentials and a lack of MFA), with Ticketmaster among the affected organizations.
122. Live Nation confirmed the Ticketmaster incident after a threat actor allegedly offered Ticketmaster user data for sale; reporting tied the exposure to claims involving approximately 560 million users’ data.
123. In the same Snowflake-linked breach wave, reporting noted Santander data associated with approximately 30 million customers being offered for sale.
As SaaS usage expands across departments and purchasing models, security risks increasingly stem from visibility gaps rather than technical failures. Breaches tied to unmanaged applications, credential misuse, and third-party SaaS platforms highlight how fragmented software environments amplify exposure. In 2026, improving SaaS security is less about adding new tools and more about gaining centralized visibility, controlling access, and understanding how software enters the organization in the first place.
How SaaS and FinOps Intersect
FinOps Adoption and Ownership
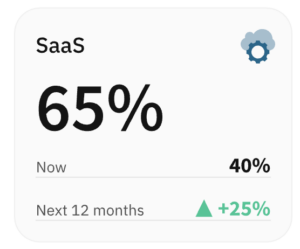
124. 65% of FinOps practitioners say FinOps manages SaaS spend today or expects to within 12 months.
125. Only 31% of organizations have clearly defined ownership between FinOps, IT, and procurement for SaaS spend.
126.Only 2% of organizations have FinOps teams that cover cloud, SaaS, and Gen AI holistically, with most teams narrowly operational rather than strategic.
SaaS Visibility and Cost Allocation Challenges
127. 70% of FinOps practitioners report limited visibility into SaaS usage data compared to infrastructure spend.
128. Less than half of organizations can accurately allocate SaaS costs to business units or teams.
SaaS Cost Predictability and Budget Forecasting Challenges
129. 82% of executives report significant increases in cloud, SaaS, and Gen AI costs.
130. Three‑quarters of organizations exceeded their public cloud budgets (by an average of ~10%), and 52% overspent on SaaS.
131. FinOps practitioners cite usage-based pricing as one of the top three drivers of unpredictable spend.
As SaaS pricing models evolve toward usage-based and AI-driven structures, forecasting accuracy continues to decline. Organizations increasingly struggle to predict spend beyond the contract signature, making visibility, usage tracking, and renewal governance essential for maintaining budget control in 2026.
FinOps Operational Constraints due to Portfolio Complexity and Redundancy
132. 12% of SaaS expenditures are unmanaged, increasing redundancy and risk.
133. According to the HashiCorp State of the Cloud survey, 64% of respondents reported they do not have all the staff expertise they need to support their cloud infrastructure.
134. 98% of executives admit to bypassing IT for tech purchases, indicating how endemic shadow IT can become.
135. 48% of SaaS expenditures are driven by business units outside IT’s control.
As SaaS spending shifts toward consumption-based pricing and AI-driven cost models, traditional FinOps practices built for cloud infrastructure alone are no longer sufficient. The intersection of SaaS management and FinOps increasingly depends on visibility into usage, ownership clarity, and accurate cost attribution. Organizations that fail to connect SaaS data with FinOps workflows face higher volatility, reduced accountability, and limited ability to forecast software spend in 2026.
SaaS Statistics By Category
SaaS Marketing Statistics
136. The average organization uses 103 marketing-related SaaS applications, making marketing one of the largest functional SaaS categories.
137. Martech stack size increased 9% year over year between 2024 and 2025.
138. Only 31% of marketing organizations report that their martech stack is well integrated.
139. 64% of marketing leaders say they struggle to keep track of all tools in their martech stack.
140. Generative AI capabilities are embedded in 42% of martech tools currently in use.
Sales Technology And Sales SaaS Statistics
141. 91% of companies with 10 or more employees use CRM software.
142. 87% of businesses use a cloud-based CRM solution.
143. 74% of CRM users say their system gives them improved access to customer data.
144. 70% of sales reps say a CRM helps them close more deals.
145. CRM can increase sales productivity by up to 34%.146. CRM applications can improve sales forecast accuracy by up to 42%.
147. 60% of respondents in one survey use CRM as a centralized system of record.
148. 80% of respondents plan to use AI to improve CRM effectiveness.
SaaS For Finance Teams
149. Expense-based SaaS purchasing increased from 1% to 3.7% of total SaaS spend, reflecting a measurable shift in how software is acquired across organizations. (Zylo’s 2026 SaaS Management Index)
150. Expense-based SaaS spend grew 267% year over year. (Zylo’s 2026 SaaS Management Index)
151. The share of employees purchasing SaaS via expense channels dropped from 7% to 3.4%, meaning a smaller group is driving more expense-based software purchasing. (Zylo’s 2026 SaaS Management Index)
152. The average number of expensed applications rose from 125 to 138, while non-expensed applications declined from 229 to 206. (Zylo’s 2026 SaaS Management Index)
SaaS For IT And Security Teams
153. 63% of organizations report external data oversharing, and 56% say employees upload sensitive data to unauthorized SaaS apps.
154. 55% of employees adopt SaaS without security’s involvement, and 57% report fragmented administration.
155. 58% of organizations struggle to enforce identity privileges across SaaS environments.
SaaS For DevOps
156. Application Development was the second-fastest-growing SaaS category in 2025, with a 81% increase in the number of applications within portfolios. (Zylo’s 2026 SaaS Management Index)
157. Application Development also experienced the largest year-over-year spend growth of any category at 176%. (Zylo’s 2026 SaaS Management Index)
SaaS portfolio growth in 2026 is no longer evenly distributed across the organization. While marketing, collaboration, and IT operations show signs of consolidation, development- and engineering-focused categories continue to expand rapidly, both in application count and spend. This uneven growth increases portfolio complexity and reinforces the need for category-level visibility to understand where SaaS expansion is accelerating and where consolidation opportunities exist.
Emerging Trends In SaaS Personalization
158. 71% of customers expect personalized interactions from the software they use.
159. 76% of customers say they feel frustrated when personalization is missing.
160. When handled well, personalization can reduce customer acquisition costs by as much as 50%.
161. The right kind of personalization can increase marketing ROI by 10% to 30%.
162. Companies with faster growth derive 40% more revenue from personalization than slower-growing competitors.
As SaaS platforms embed AI directly into workflows, personalization is shifting from an optional enhancement to a baseline expectation. In 2026, personalization increasingly influences adoption, engagement, and buyer behavior. This reality places pressure on SaaS vendors to tailor experiences at scale without increasing operational complexity.
Sustainability In SaaS
163. Data centers account for approximately 1-1.5% of global electricity consumption.
164. 88% of business leaders will increase IT investments in sustainability over the next 12 months.
165. 90% of surveyed executives believe AI will positively influence sustainability goals.
166. Cloud computing may reduce energy consumption by 35-45% compared with legacy on-premises IT.
Sustainability is increasingly intertwined with SaaS procurement decisions. As organizations evaluate software vendors, environmental commitments, infrastructure efficiency, and cloud sustainability reporting are becoming important factors alongside cost and functionality.
The Rise Of Low-Code And No-Code SaaS Platforms
167. Per Gartner, by 2026, 75% of new applications are expected to be built using low-code or no-code technologies.
168. Low-code adoption reduces application development time by up to 90%.
169. Gartner predicts that developers outside formal IT departments will account for most of the low-code/no-code user base.
170. Nearly 60% of all custom applications are now built outside the IT department; and of those, employees with limited or no technical skills built 30%.
171. 41% of businesses have active citizen development initiatives, and a further 20% are planning or evaluating them.
Low-code and no-code platforms are reshaping how software enters the enterprise. By enabling business users to build applications independently, these platforms accelerate innovation while introducing new governance and visibility challenges for IT teams.
SaaS Gig Economy
172. 36% of U.S. workers participate in freelance or contract work in some capacity.
173. Approximately 22.1% of U.S. employees worked remotely in August 2025.
174. Between 25% and 43% of the workforce has engaged in gig or non-standard work, including occasional participants.
175. 16% of Americans have earned money through an online gig platform.
176. 62% of U.S. adults now earn money working for one or more gig platforms.
The growth of contract and gig-based workforces is reshaping SaaS access management. Short-term users, temporary licenses, and fluctuating access needs increase operational risk and software waste, underscoring the centrality of identity governance and lifecycle management in modern SaaS environments.
Why SaaS Statistics Matter for Software Governance
SaaS statistics expose how software is purchased, how costs escalate, and where governance gaps emerge. In 2026, organizations face fewer decisions about whether to adopt SaaS and more decisions about how to manage it effectively. Without clear visibility into applications, spend, usage, and renewals, SaaS portfolios quickly become sources of financial and operational risk rather than a source of business enablement.
Zylo helps you understand how those trends manifest in your own environment. With complete visibility into applications, spend, renewals, and usage, Zylo enables organizations to take control of SaaS sprawl, reduce risk, and make smarter software decisions.
Request a Zylo demo to see how SaaS Management data becomes actionable insight.
FAQs About SaaS Statistics
Key trends shaping SaaS in 2026 include increased adoption of AI-native applications, rapid growth in usage-based pricing models, rising renewal volatility, and greater overlap between SaaS management and FinOps practices. Organizations are also seeing stabilization in total app counts alongside continued growth in spend and complexity.
The global SaaS market continues to expand rapidly, with industry forecasts projecting hundreds of billions of dollars in annual revenue and sustained growth driven by cloud adoption, AI integration, and enterprise digital transformation.
Zylo’s statistics come from its dataset of more than 40M licenses and $75B in SaaS spend under management—the industry’s largest and most robust.
The SaaS Management Index, published annually by Zylo, is an industry benchmark that tracks how enterprises buy, manage, and optimize SaaS at scale. Built on Zylo’s proprietary dataset of real SaaS spend, usage, and license data, it provides an objective view into SaaS economics, risk, and operational maturity.